The Australian Taxation Office (ATO) has recently published their SMSF statistical overview for 2017-18 which provides key insights from the published data about the health and performance of the SMSF sector.
There’s always a lot of focus on some of ‘headline’ statistics, which this year was around operating expenses. The ATO has done some excellent work to dispel the inaccuracies published by ASIC in the SMSF fact sheet (more on this below). As part of the ongoing work I do around trends and the direction of the SMSF sector, these statistics help tell a story about where we might be heading, both from a legislative and policy setting perspective.
That’s why I’ve put together my ten things from this year’s SMSF statistics.
1. Revised operating expenses show SMSFs true costs
It wouldn’t be unreasonable to say the ASIC’s has quite a strong position against the SMSF sector over the past few years. Not necessarily unwarranted given some of the unscrupulous property-spruikers, but their decision to issue a fact sheet of SMSF costs that was grossly incorrect did leave a bitter taste amongst those in the sector actively focused on continuing to drive a well functioning industry and profession.
We saw in the release of the 2017-18 statistics that operating expenses showed a median of $3,923, far short of the average costs of $13,900 stated in ASIC’s fact sheet. Here’s a couple of other points worth noting as we drill down on these expenses:
- Looking at total expenses, the median at $7,710 is far lower than ASIC’s previous figures being relied upon from the Productivity Commission data used in the fact sheet. Clearly this data is skewed by some of the ‘mega SMSFs’ ($10M+ fund balances), where average expenses for a SMSF >$2m are $29,472 (median $15,814).
- 84.4% of all SMSFs have operating expenses under 1.0%, 43% under 0.5%; 44.5% of funds have total expenses at less than 1.0%.
The sector has for a long time been deemed ‘well functioning’, going back to the Super System Review in 2010. However, this level of accountability with the use of information seems to be a one-way street. That is, where an adviser or accountants makes such a false and misleading statement, then they would naturally be in serious trouble for such actions. This is by no means suggesting that the advice and disclosure standards should be relaxed, but rather they should be held accountable to an equal standard as an SMSF industry stakeholder.
Given that these statistics were published by the ATO on 22 June, you would like to think that ASIC would promptly make such changes to reflect these statistics, yet a couple of weeks later the fact sheets remain.
2. SMSF pension members clearly benefiting from advice
This year’s statistics for the first time include data post the 1 July 2017 reforms where the transfer balance cap (TBC) was introduced. With this cap it also introduced new strategies in how a member withdrew their super benefits – across both pension payments and lump sums. It is clear from these statistics that SMSF members are “in tune” with the strategic decisions about how benefits need to be taken to maximise ECPI and utilise in a longer term estate planning context.
From the statistics:
- Total benefit payments declined by 15% in 2017-18, with
- a nearly 16% decline in pension payments, in contrast to lump sums that more than doubled – increasing from 13.7% to 29.7%. These would have resulted from both lump sums from accumulation accounts of members with balances above the TBC, along with those undertaking commutations to claw back amounts against their TBC.
3. SMSF net fund flows
Over recent years there has been a steady trend towards outflows within SMSFs being greater than inflows – this has occurred for a couple of reasons:
- Increasing number of members drawing down retirement phase income streams; and
- Reductions in the ability to contribute (through the lowering of concessional and non-concessional contribution caps and the introduction of a member’s total super balance (TSB)).
However, the 2017-18 data shows a ten-fold increase in outflows over inflows with a net outflow of $22.5 billion. The data also shows that 43% of funds are in full retirement phase or partial retirement phase. It will be interesting to see whether this increase is now a more permanent fixture of the statistics which will certainly have an impact of total assets in the SMSF sector in the longer term.
4. Auditor numbers
With a re-calibration of SMSF auditors over the past few years after the introduction of ASIC auditor registrations, the statistical breakdown now doesn’t appear to reflect the current landscape of approved auditors. For example, 50.9% of auditors do greater than 250 funds, so why doesn’t the ATO extend their data further to create a better understanding how the auditor market is actually broken down beyond this figure? Surely they could break down in further segments of 251 – 500, 501 – 1,000 and 1,000+ funds as a starting point?
5. Tax Agents
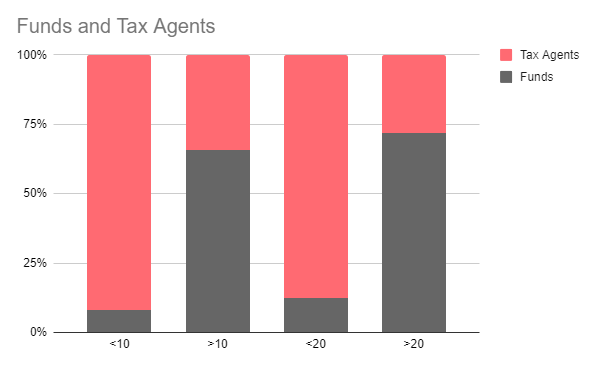
This has been an area of interest for some time since discussing in the Future of SMSF report. The statistics show that the average number of SMSF clients was 34 and the median was 10. However, it when you take a closer look at the data it tells a much more compelling story:
- 50% of all tax agents in the SMSF sector do less than 4.5% of total SMSFs – yes, that’s not a typo – an average of 3.7 funds per agent. This is in contrast to the remaining 50% of the tax agents that have an approximate average of 82 funds under their tax agent’s licence.
- If you break this down at <20 funds, it represents 64% of agents (average <6 funds), with the remaining 36% having an average of 109 funds.
To me this highlights some important points and challenges for the Regulator. The numbers of agents are marginally declining however that ‘gap’ between the providers is going to create continuing problems as technology evolves, further legislative change and regulatory reform. As previously mentioned within the Future of SMSF report, it is these types of unique risks that may need to be further addressed as part of the future advice framework for the SMSF sector.

6. Continuing to attract younger members
Both the annual statistics and the quarterly SMSF statistics continue to show that SMSFs are continuing to attract younger members, with 63.7% of new members under the age of 50. When looking at the overall SMSF population, only 25% of member of under 50 years of age.
As I have also previously indicated, this creates some interesting challenges for professionals in building a value proposition that may look very different for new entrants as opposed to older, long standing SMSF clients.
7. LRBAs within a fund’s investment strategy
We saw in September 2019, the ATO write to 17,700 trustees raising concerns about how they have adequately considered diversification within their investment strategy. This of course, become something much bigger for the SMSF industry with a much greater awareness and focus on a fund’s investment strategy. The statistics once again highlights the high levels of asset concentration risk that exists in many SMSFs. As a result, will the ATO continue its approach towards diversification with SMSF investment strategies?
The statistics show that:
- 10.2% of funds reported a having an LRBA, up from 9.5%;
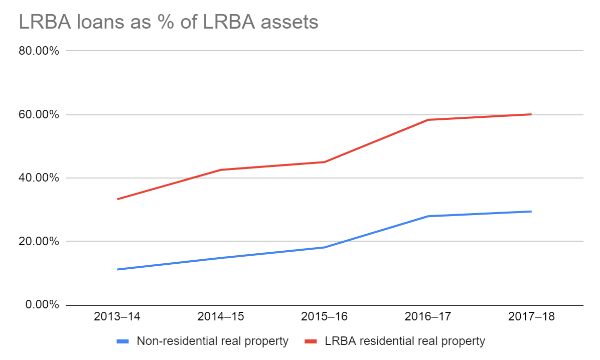
- Exposure to debt has continued to increase over the past 5 years, representing 60% of residential property within SMSFs, however as a representation of total SMSF assets, LRBAs have remained steady at 5.9%.
The diagram below highlights how SMSFs have progressively increased their exposure to debt on real property over the past 5 years:

8. Asset concentration risk remains a concern
Following on from point (7), the management of asset concentration risk will still remain high on the radar for the Regulator with 30.1% of all SMSFs having 90% or more asset concentration within a fund.
We know that the ATO undertook a targeted campaign last year with funds invested in property with an LRBA to demonstrate how they have adequately considered diversification. However, with COVID-19 significant impacting financial markets, it has again highlighted the importance of how trustees manage risk due to market volatility.
Interestingly, when you look at SMSF asset concentration by phase, where asset concentration is 90%+ within a fund, 35.7% is SMSFs in accumulation phase, with 22.8% in retirement phase.
Upcoming live event
Aaron Dunn will be discussing the impact of the ATO’s SMSF statistical summary in the upcoming live event on Tuesday, 21 July 2020 with the ATO’s Acting Assistant Commissioner of the SMSF Segment, Steven Keating.
Find out more and register here, https://smartersmsf.com/event/ato-2020-21/


Thanks for sharing this useful information This blog explains the details about what happened after the expressions.
SMSF Warehouse